Gustavo Reyes, food safety manager for Western Growers, recently invited Creme Global’s head of data science, William O’Sullivan, and Claire Zoellner, Director of Data Science for iFoodDS to discuss how organizations can better use their data.
William outlined the data journey from collection to decision-making tools like static reports or interactive dashboards.
The talk covered four main stages:
- Data collection and storage
- Artificial intelligence and machine learning
- Exploration, modeling, and analysis
- deployment and communication of results
They emphasized the importance of accurate and relevant data and discussed techniques like regression, classification, clustering, sequence prediction, and natural language processing for modeling.
William also presented a case study on improving yield with predictive regression. He highlighted the significance of understanding data, selecting appropriate techniques, validating models, and utilizing results to enhance operational intelligence and flexibility.
You can find the full recording here or read the automated transcript below.
From Data to Decisions: Data science for data owners
I’d like to open this talk about the journey that data takes from its initial collection to utility for your decision-making in either static reports or interactive dashboards.
Presentation overview
- Data collection and storage
- Artificial intelligence and machine learning
- Exploration, Modeling, and analysis
- Deployment, communication, and results
- Case study: Improving yield with regression
There are four primary stages involved in turning your data into a commodity or a tool for informing your business decisions.
When we discuss the practical application of data science, we’re looking for three main objectives at the end of the process.
- Increase operational flexibility so that you can react to changing situations.
- Increase operational intelligence so that you are aware of what’s going on based on the data you’re collecting or
- Provide opportunities to refine your standard operating procedures, identify ways to work better, and help you implement them accordingly.
So, step one here will be about data collection and storage. Step two will be about artificial intelligence and machine learning, with an emphasis on machine learning because it ties more closely to the work that we end up doing the most heavy lifting with. We’ll then talk about exploration, modeling, and analysis.
These are the components whereby we consult with individuals, businesses, organizations, or parties thereof who have information, the data owners, to find out what techniques will work to solve the relevant business or scientific questions. Finally, we’re going to talk about deployment and the communication of the outcomes of these models, as well as the results those models produce.
Finally, we will examine a case study based on a client for whom we’ve successfully applied this process.
Data collection and storage
So, let’s start with the fundamentals. The data storage and the collection of that data.
At the beginning of any good data science process, you need to identify the data you’re working with.
The foundation of good data science
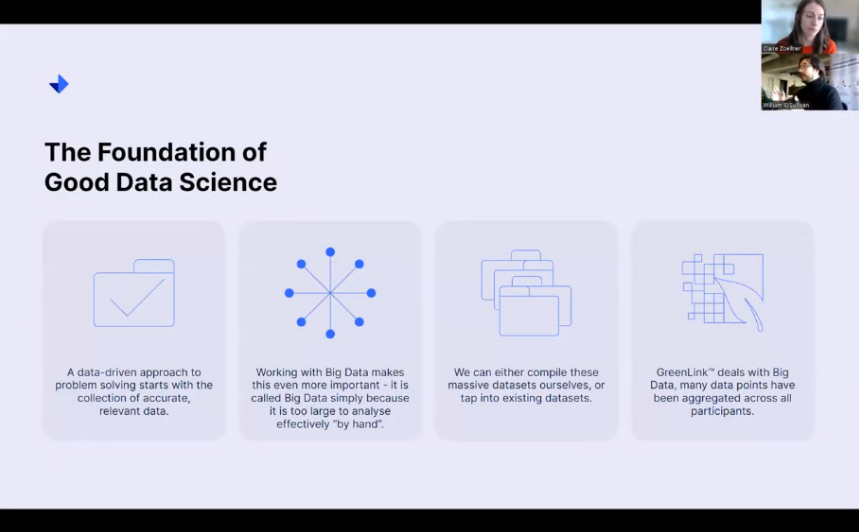
When it comes to defining the business questions or the scientific questions of interest, it is critical that you are able to both identify and collect accurate and relevant data. If your data is inaccurate, of course, your analyses are going to be inaccurate.
You might be able to answer other questions that your business may be interested in. But they will not be the ones you necessarily set out to answer in the first place. This is what makes the tooling offered by both data science as a practice and machine learning as a tool much more useful.
When we start working with big data, we go beyond dealing with data sets that you can handle manually.
For example, if your data is trackable to one spreadsheet or if you can put all your information about a business there, it’s not big data.
Though it’s a bit painstaking, you can send someone to trawl through that and try to find insights and analyses there accordingly. When you get to the scale of big data, you need machine intervention to process information and start pulling useful bits of knowledge out of that data.
To that end, these data sets can either be compiled by the data owners themselves. Often, very large organizations already have a culture or a history of collecting different kinds of data. But other projects see us tapping into existing data sets.
Big data is not resident in one person’s system. It is a collection of data across loads of different systems that need to be connected and joined together. It needs to be understood in the context in which it really can exist. Greenlink®, as an example, is a project run by the Western Growers Association and powered by the Creme Global Platform. It deals with big data as many data points have been aggregated across all of the Greenlink® food safety data sharing platform participants.
So, by virtue of all of these individual data owners coming together, they can share data, open up, and unlock industry-wide trends that only appear when folks are willing to aggregate their data together.
So, how do we take all of this big data and break it into tractable chunks that actually allow us to start applying scientific methodologies, start building models of the systems that we are trying to reproduce for the purpose of testing them, or run experiments?
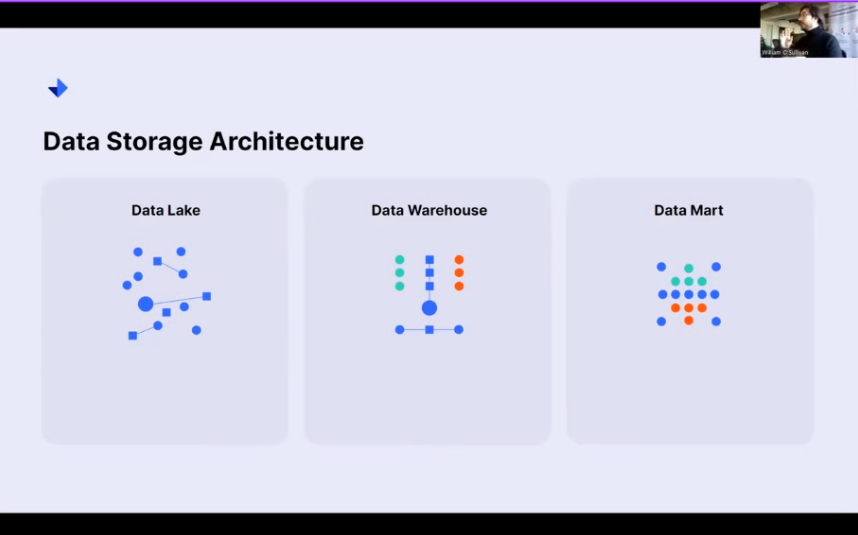
Data storage architecture
How do we do the science part of data science?
It starts with data storage architecture. Here, I have three main components that I’m going to talk through very briefly: a data lake, a data warehouse, and a data mart.
Data Lake
A data lake is where you would store your raw and unstructured data.
Everything that you need to tie together, everything you’ve identified, is either accurate or relevant because it might not always be both. People are willing to, are encouraged to even chance that this might be accurate, this might be relevant, and this might help us build out a really good picture.
So rather than neglecting it for the fear that it might not be perfect, we won’t include it. The data lake can take everything. It’s a lot of computer storage, but ultimately, it doesn’t have to be anything more complicated than that just yet. Getting this data together can often be a hard step in any organization’s journey because it involves centralizing information.
That is a big effort, and while technologically not super complicated, building a good data lake requires focus and dedication.
The data warehouse
The data warehouse is when we start exploring that data lake and putting the rules in place for determining how we will pull together a validated, clean, structured format that satisfies both the criteria of relevancy and accuracy.
How do we parse signal from noise? These data warehouses, because they process a load of information in a data lake, use comparatively complex data engineering tools. We take that data and turn it into something useful.
Data Mart
That’s still a lot of data to analyze. It sits in that realm of big data, not really tractable. We want to understand how it fits into a problem-solving framework. We digest that then a little bit further by down-selecting from that data warehouse to create a Data Mart. This Data Mart is always designed to answer certain questions.
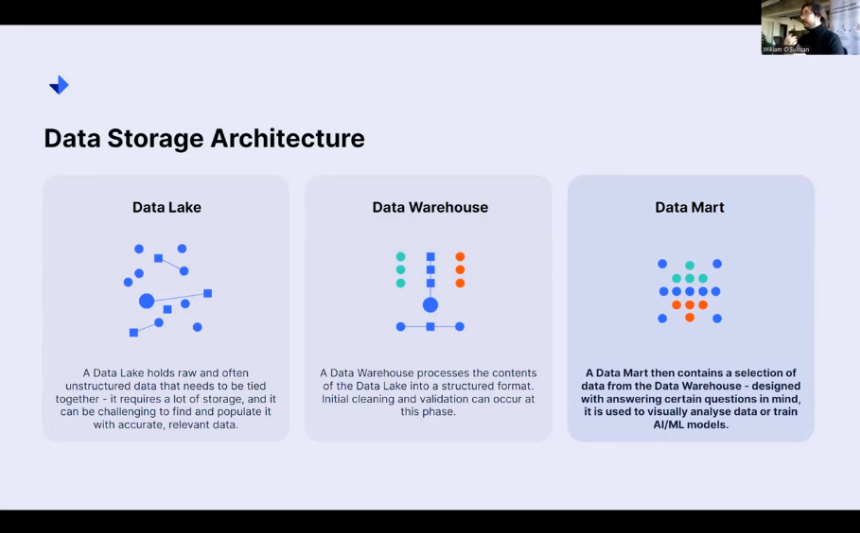
It is the definition of a test bed for any kind of question you would like to ask of your data. We can use a data mart to visualize information. It’s often underestimated how effective people can be just by picking out visual patterns. That can be the first step towards even defining the questions you’d like your data to answer for you further.
Alternatively, we can use these data marts to essentially train machine learning models that feed into artificial intelligence.
AI Artificial Intelligence and machine learning
Hopefully, the next image will provide a bit of a distinction for you so that if you end up talking to folks about the contents of this presentation after the fact, you’ll be able to say pretty confidently, you know what, I know the distinction between artificial intelligence and machine learning now.
This is how they differ. This is why we might use them differently. This is how they work differently. It is a nice edge to have in conversation when it comes to thinking about what role artificial intelligence or machine learning potentially plays in my business.
The difference between AI and machine learning
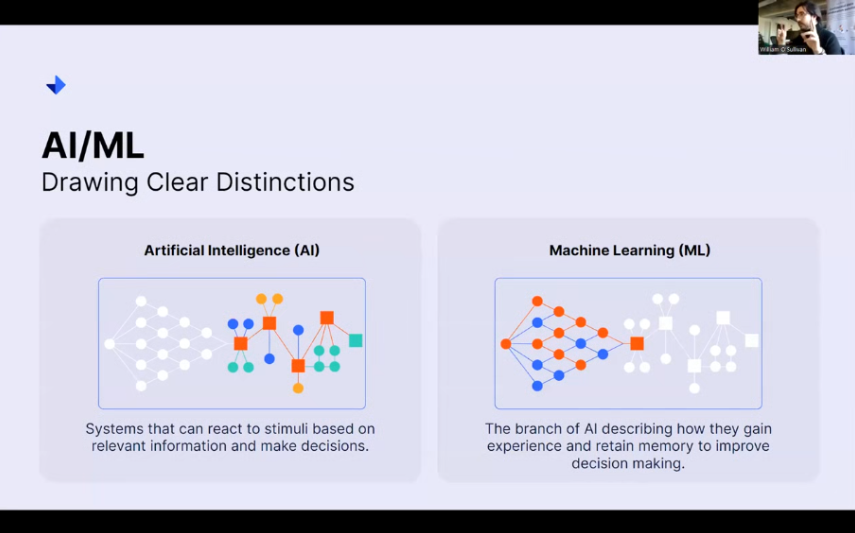
So an artificial intelligence.
It is, quote-unquote, simply a system that can react to stimuli. So any events that might happen, any change in parameters or inputs, if you have sensors hooked up, any number of little bits and pieces, it can react to stimuli based on relevant information to make decisions. So you’ll see on this diagram on the left that we have these wonderful colored items. We are looking at all of these different decision points as denoted by these squares.
Ultimately, it ends up being the kind of output decision that this artificial intelligence makes. You’ll see each one of these decisions are fed into by different kinds of data processed in different ways. Ultimately, AI itself has one particular job that separates it from machine learning: making decisions.
On the other hand, machine learning is not so concerned with making decisions in terms of how they would impact a system. You would imagine artificial intelligence would schedule something for you because it knows that your calendared behaviors are this, you expect this, and these kinds of products to enter warehouses. All of these other parameters feed into artificial intelligence.
A machine learning algorithm may be concerned with gaining experience and retaining memory to improve decision-making. That’s why we fold these two diagrams into one another. You can have a really good AI powered by a really good machine learning algorithm. But to the contrary, you don’t always need artificial intelligence to sit on top of a machine learning algorithm to get value out of it.
We see here in that diagram on the right that this machine learning diagram also ends in a decision point. We don’t necessarily need artificial intelligence to interpret that. We can use natural or human intelligence to say oh, the machine has found this trend or this behavior. And now, I need to react because I have information that this kind of diagnostic tool is provided to me that allows me to either do my job better, faster, or in a more responsive way.
Therein lies the distinction: AI, decisions, and machine learning give you information. There are a number of different techniques that we can actually use to feed AI-type systems or even systems that work on natural intelligence. These five that I’ll be discussing here today relate to regression, classification, clustering, sequence prediction, and natural language processing.
Categorising Machine Learning Techniques
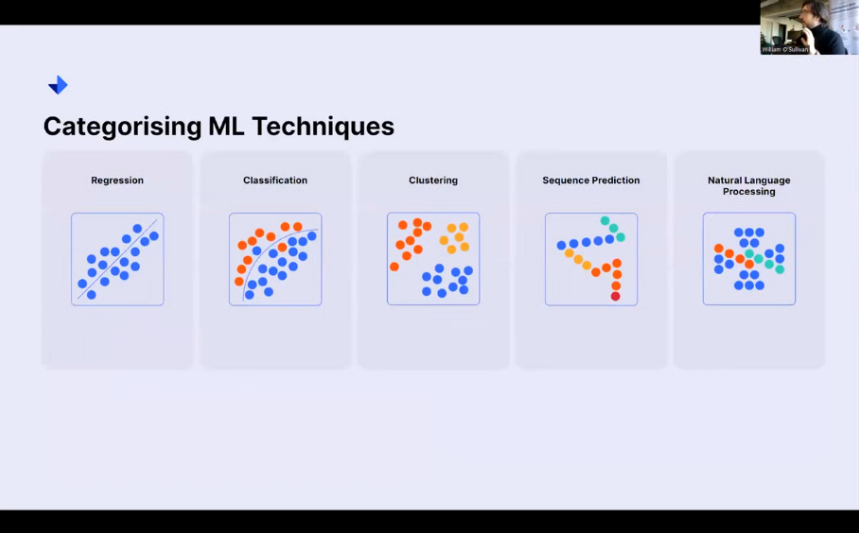
And I know upfront that can seem quite intimidating, but we’re just going to quickly walk through some of the advantages and disadvantages of these techniques so that if you have a problem, and you identify, Oh, this is actually what my kind of problem sounds like. I need to figure out how certain variables relate to one another, or I need to figure out how to divide different items into different groups.
Hopefully, you’ll be able to say, Oh, you know what? I need this technique to solve my problem going forward.
Regression
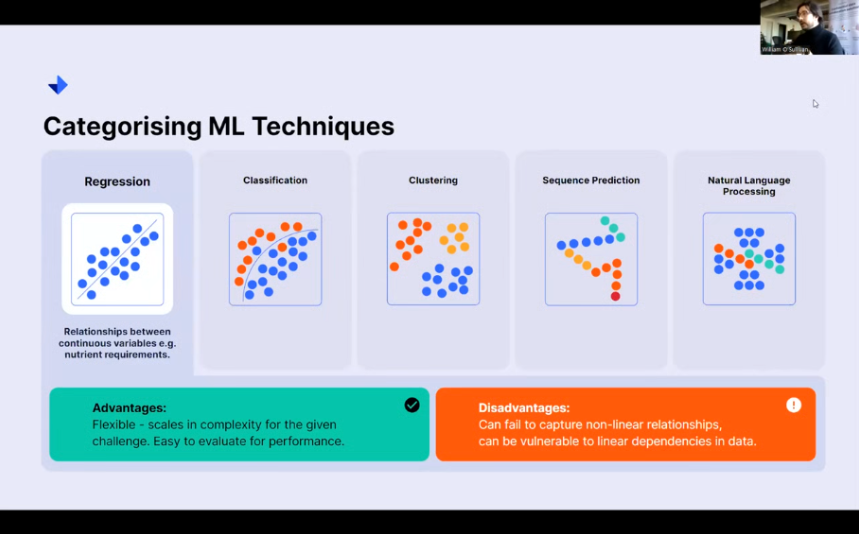
Regression is a machine learning technique concerned with determining the relationships between continuous variables. I give an example here of determining the nutrient requirements for a given crop.
If you know you’ve got a given soil type, a given seed that you’ve sown, a given season you’ve planted it in, and a given location, all of these values can be numerically encoded. And you can essentially say, with all of these inputs in a numerical format, what is my numerical output? What kind of fertilizer do I need to give in these conditions for optimal crop growth?
Regression models are great. They are a wonderful bread-and-butter tool that any kind of data scientist would use when working with the fundamentals of machine learning. And they can solve a lot of different problems. They are very flexible, and they scale up in complexity very nicely. And they’re very easy to evaluate for how good of a job they’ve done at understanding the problem that you want them to solve.
Again, we’re talking about machine learning. There’s an element of machine intelligence. Is it really understanding? What’s going on? We can find that out pretty handily with regression tools. However, depending on the type of regression model that you use, there can be challenges in capturing different kinds of relationships.
A lot of the time, you can imagine a linear response. If I increase the sunlight available to this particular crop, it will grow, but then, of course. At a certain point, you start seeing nonlinearities. Obviously, if you fry it with UV light, it’ll start to die. These are nonlinear relationships outside the nice bounds of linear behavior that certain regression models might not do well at.
So you’ve got to make sure that you’re accounting for those accordingly.
Classification
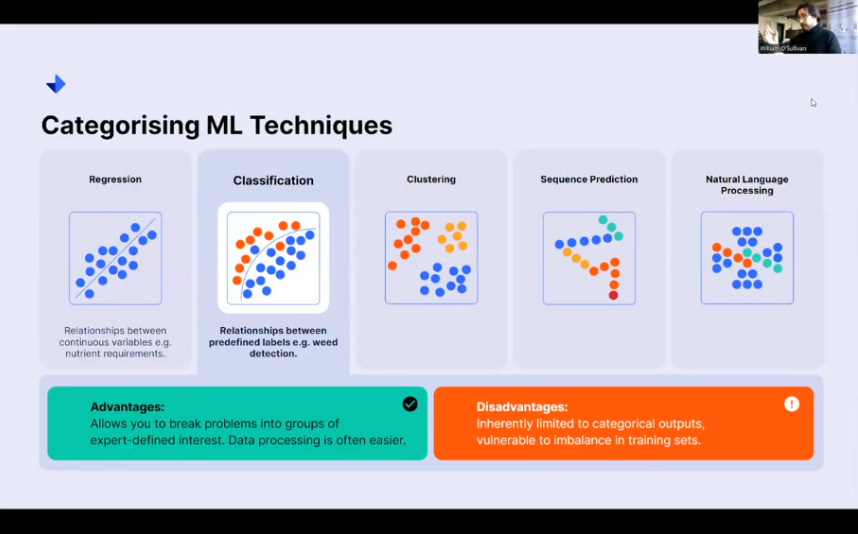
Classification-type models define relationships between predefined labels, classes, categories, or any kind of grouping that you might be interested in describing. This is a really nice tool to use with clients who know their data really well because it allows you to break problems into groups of expert-defined interest.
If you know that you are interested in specific ranges of values. We can say, look, this is an out-of-tolerance value. This is not an out-of-tolerance value based on our natural understanding of tolerance. We can impart those very easily into the ML algorithm. And from there, we can just say, all right, analyze this data, look for these trends, draw these lines for me, and let me see the data where my expert-defined definitions hold and where they don’t, and you often find that it’s where those deviations occur that you’re most likely to generate that really interesting insight. Unfortunately, of course, this is going to be only limited to categorical output. You’re not going to get the nice numerical answers you would get from a regression model because you’re looking at putting things into class A, class B, class C, and so on.
Similarly, these techniques can be vulnerable to imbalance in training sets. So, if you have far too many of the, say, blue dots here, the line you draw that effectively separates the red dots Might not be a very good representation of how that works in the real world.
So, the kind of data that you have available will also inform you of the techniques you use.
Clustering
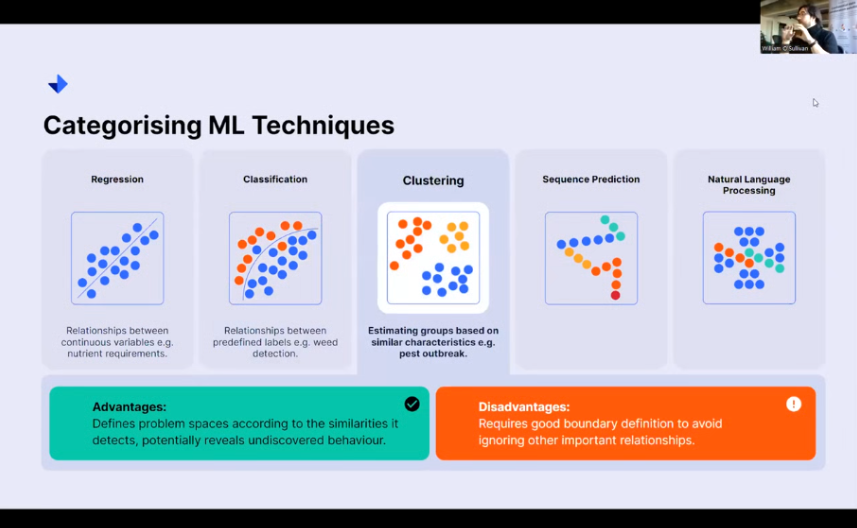
Clustering then allows you to sidestep the need for expert knowledge. This is also a very useful technique when you’re doing exploratory work with data. If someone doesn’t really know what questions they want to answer yet, they just know that they’ve collected really good-quality data.
They can have us look at the different types of groups that naturally fall out of the data. Of course, in pest outbreaks, if you want to know what the kind of common behaviors are that would lead to any kind of pests emerging in fields, as soon as you start clustering all of these different crops together, you might start realizing, oh, all of these are now in a certain kind of condition or have recently been affected by a certain weather event or so on, so forth.
Any number of conditions can appear that say, These are common behaviors, and we should be able to identify what that common behavior is, and we can treat those accordingly. So it’s really nice then to reveal that undiscovered behavior.
Sequence prediction
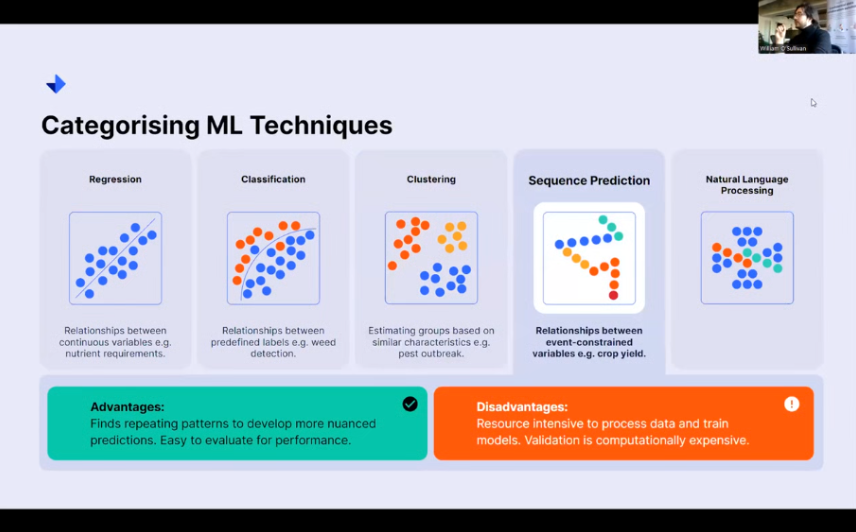
Sequence prediction steps into a more complicated space, then, because while this kind of regression classification model can look at the state as it is, sequence prediction is concerned with learning about patterns that repeat themselves over time.
These are really good for developing nuanced predictions. If you want to look at how your crop yield is going after multiple harvests over many different points in time, you can use models like these to analyze the time evolution of these entities in order to evaluate these really particular time-sensitive questions.
These models do come with drawbacks, though. As they pull in more data, they’ll be more resource-intensive to train and process. They’ll be more data-hungry than many of their other counterparts might be. So, if you have a lot of data, if you’ve got a lot of time-bound data, sequence prediction can be a really good tool for you to use.
Natural language processing
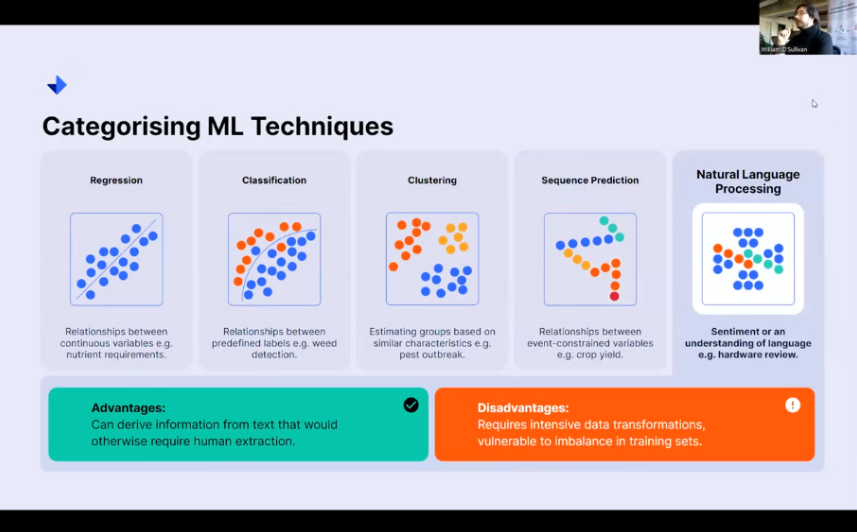
And finally, natural language processing looks to understand sentiment analysis. I’m sure most people have heard about chat GPT. Essentially, trying to pull information from text that otherwise would require a human to do the job. Being able to have a machine pull information out of text is an incredibly valuable tool that we now have at our disposal.
So, being able to pull reviews for different kinds of farming apparatus can make a big difference to anyone who’s trying to buy new materials or tools for their ranches. Alternatively, if you’re one of these producers, you can see what people like and adapt your design policies accordingly.
Exploration, modeling, and analysis of data
So, to move things on, we’ll start talking about the exploration and the modeling and analysis of data itself. As I’ve mentioned so far, this is, the data does have to come in consultation with the client, the people who know their data. This consultation allows us to find out structural information, so how all of these different data sources might need to be tied together, as well as contextual information.
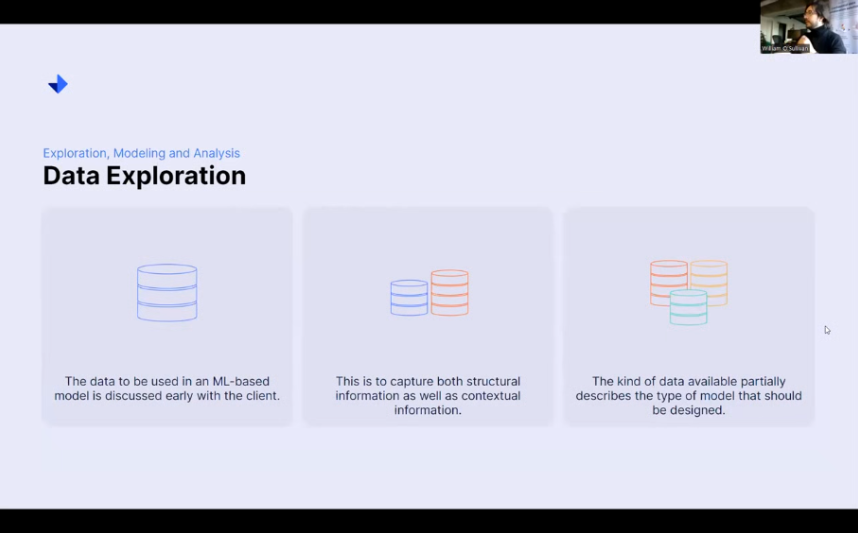
Why does this particular bit of data matter more? Oh, it was collected under these methods that aren’t explicitly listed here, but you should know, for the purpose of tying it all together, that structural and contextual information can make or break certain types of projects. So it’s really good to have a very honest and good conversation about the type of data you’re working with upfront.
This available data will describe the type of model that you can design.
Discuss modeling plans
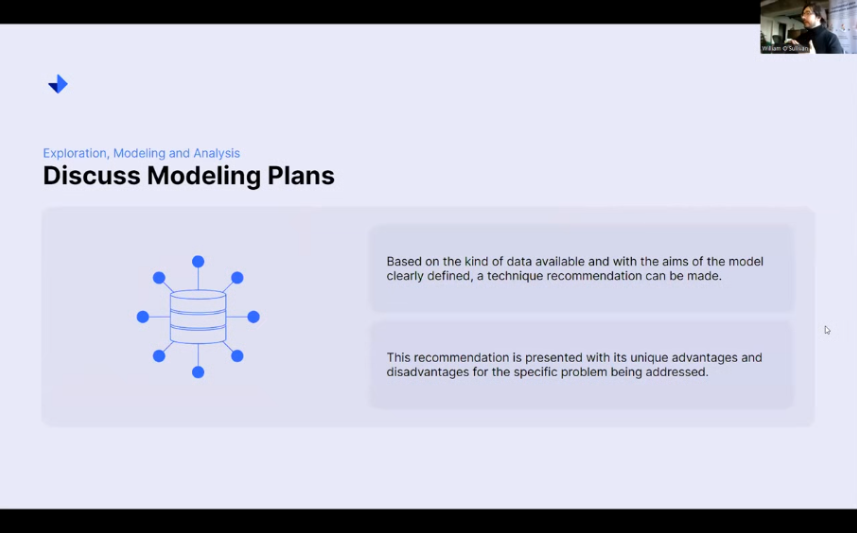
Based on that data and with the aims of what you really want to model and what questions you want to answer, you can recommend the techniques, either regression, classification, clustering, sequence prediction, or natural language processing, to answer those questions.
Those are only five of a myriad of additional techniques, but you can start looking at the right tools for the right job. This recommendation presents unique advantages and disadvantages for the problem being addressed. So you saw the disadvantages and advantages previously, but of course, on a data-by-data basis, that might actually change further.
Specific methodology
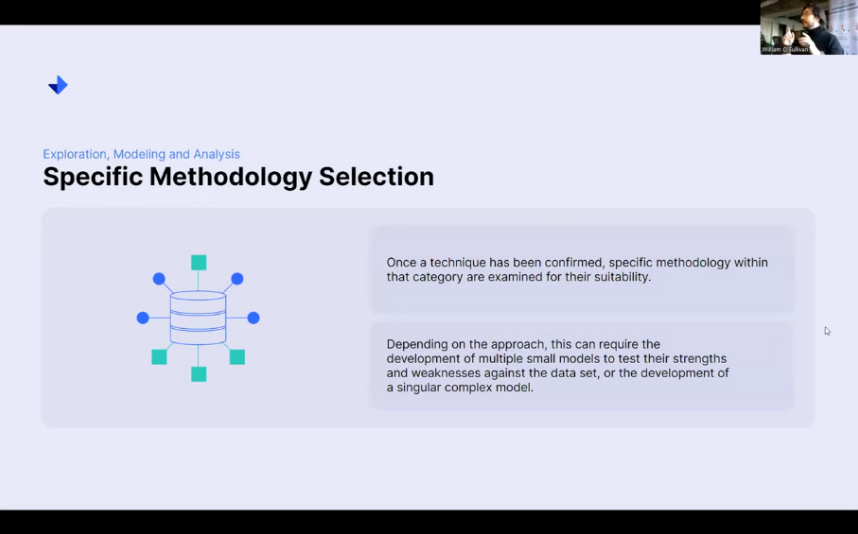
Once we have the technique nailed down, we decide on the methodology we’ll use. Depending on the approach, you might want to make 20 little models that are really good at one particular thing. Then, we find that when we sum them all together, you only really need 10.
So you can get rid of the worst-performing 10. You’ve got a very good, reliable, robust model. And all of a sudden, wonderful, you’ve covered all the weaknesses in that data set. Or you can bucket your resources together and say, I really want to drill into solving these problems. We create one model that gets it.
One model that really has a good intuition for everything that’s going on regarding this kind of data. That approach varies again based on the data, the approach being taken, and how you go from there.
Technique validation
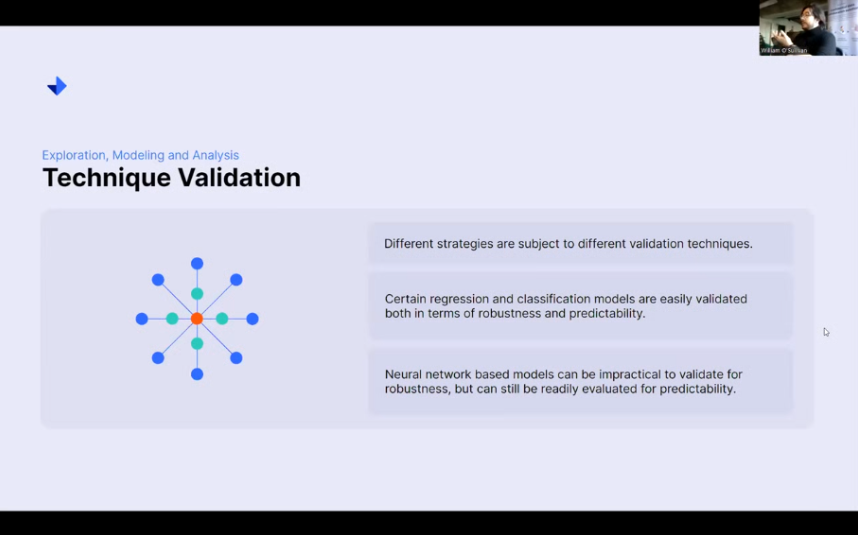
When it comes to evaluating these techniques and determining whether they are valid, invalid, accurate, or inaccurate, you have to have the right metrics in place to ensure their performance.
Regression and classification models are pretty easy to evaluate, both for their robustness, which means how well they deal with being trained on different data, how well they really understand the problem, as well as predictability. How close was your answer to the mark? Now, neural network-based models, which are a slightly more intensive body of work but are still quite useful, of course, to anything else that we’re doing, really can be a little bit impractical to try and validate in terms of robustness, but in terms of whether or not it’s right or wrong, it’s exactly as easy to say, yep, the model was this far off the mark for defining these different situations.
Model Utilization
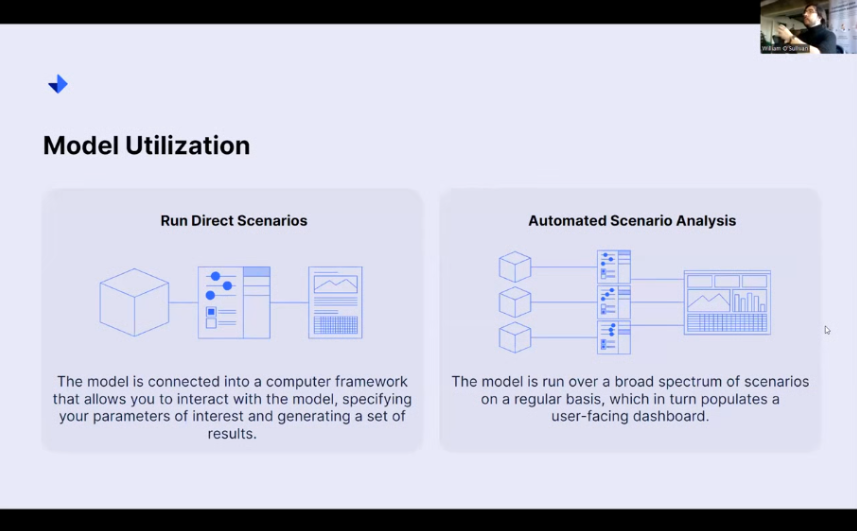
And so now, as we get closer to the end here, we talk about how we use different models and how we’re going to put the results back in the hands of the actual data owners themselves. So, there are two main scenarios that we would like to run with here. One is running these direct scenarios. So you, as someone with an intimate knowledge of both the problem space that you’re trying to work in and the data, you can say, I want to configure a model to run this kind of scenario.
You can send that off, and it will run on cloud computing services. Alternatively, you can say, ” Hey, look, these are the different case studies I’d like you to run. If you get new data from our automated data ingestion system, run all of these scenarios again and just give me the results.
I want to see how all of these different things play out. So you get different levels of customization in terms of whether I only really want to examine this family of behaviors or know everything in aggregate. Based on these kinds of predefined scenarios, there are two ways that we can generate the static reports or the interactive dashboards accordingly.
Visualization to answer key questions
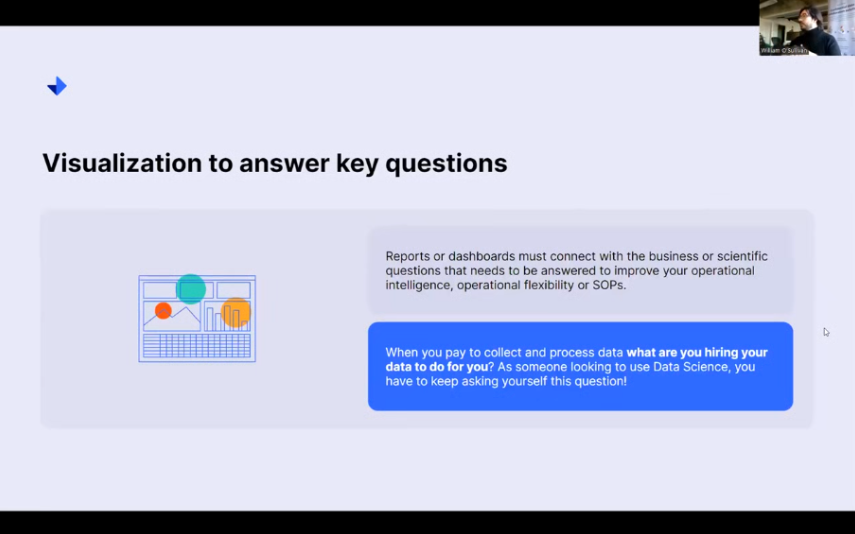
Ultimately, these reports of dashboards have to connect back to those business or science questions that ultimately aim to improve operational intelligence, operational flexibility, or your standard operating procedures. Anyone here who is a data owner is already paying to collect and process your data.
So I’d like you to maybe ask yourself, what are you hiring your data to do for you? It is a commodity. It is an asset that you own. Are you getting the most value out of it? And if you’re someone who’s looking to use data science, you have to keep asking yourself this question. I have one more slide here just for a case study into how we’ve applied this method to a client working with a yield problem.
Case study: Industrial predictive regression
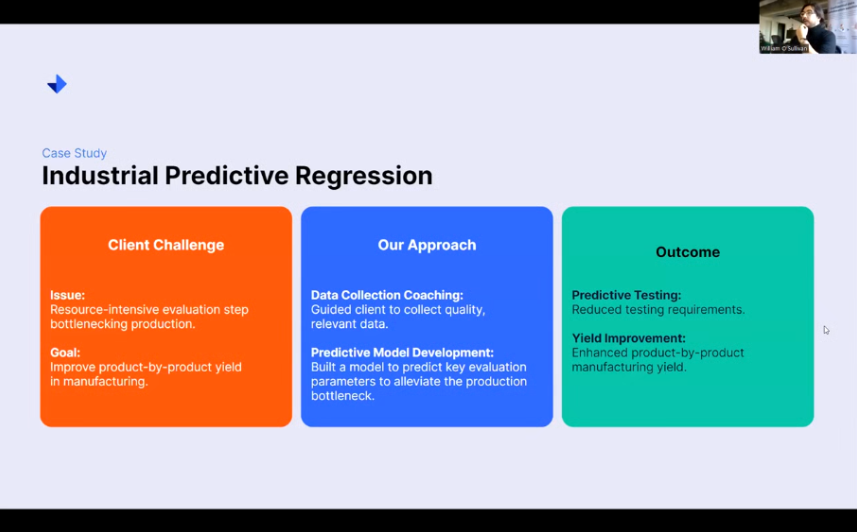
This is a case study regarding industrial predictive regression. Essentially, one of our clients had a very resource-intensive evaluation step. They had a bottleneck in production whereby all of their products would get to a certain stage. They’d have to run a test. Go off to the lab, get the result processed, get the result back, and then all of a sudden, you could release onto the next stage of production.
You have to do this for every batch of product. So, our goal off the bat was to improve that product-by-product yield. We approached this problem in two particular ways. The first was simply by coaching data collection. Cultures of data collection are not universal.
The practices surrounding what makes good data collection for good data science are not ubiquitous. Not everybody knows what works. So, a part of our work there was coaching our client on how to collect data designed to answer their original problem. On top of the data we collected, we developed a model to predict the values of that actual test.
This meant that when it came to moving their product through the factory, they could actually assess their product based on a few numerical parameters that they would have had ahead of time, and they could say whether or not a test would pass or fail. And so they reduced their testing volume by 95%, so one in twenty times, they would still test.
It was purely for cursory observation and making sure that everything was still lining up nicely, but of course, that 95 percent increase in throughput enhanced their yield. Their product wasn’t just hanging around anymore and losing water mass, so their mass by mass-based yield went up, and they were very happy campers.
Thank you so much for your time, folks. That’s been a bit of a rapid-fire runthrough of the end-to-end data process. It’s much appreciated. I’m happy to take questions towards the end.